Profile Tools
Overview of tools
With our range of Profile Tools you can visualize the raster and vector data (Z values) as a line or a point in a profile graph. Monopiles and/or cables are included in the profile at the correct location.
The tools depends on bathymetry (raster) layers, cable, pipeline or monopile (vector) layers. The application looks for layers that are marked as these object types. The Profile Tools automatically become available once these layers are found in the project.
Tools
| Icon | |
 |
Cable/pipeline profile Create a profile over a cable or pipeline. Shows the cable or pipeline in relation to the seabed floor. |
 |
Map profile Create a profile over a line on the map. Can be used to create a cross section over a cable or pipeline. |
 |
Radial profile Create a profile of several lines across a point or monopile position. Can be used to monitor scour protection around a monopile. |
 |
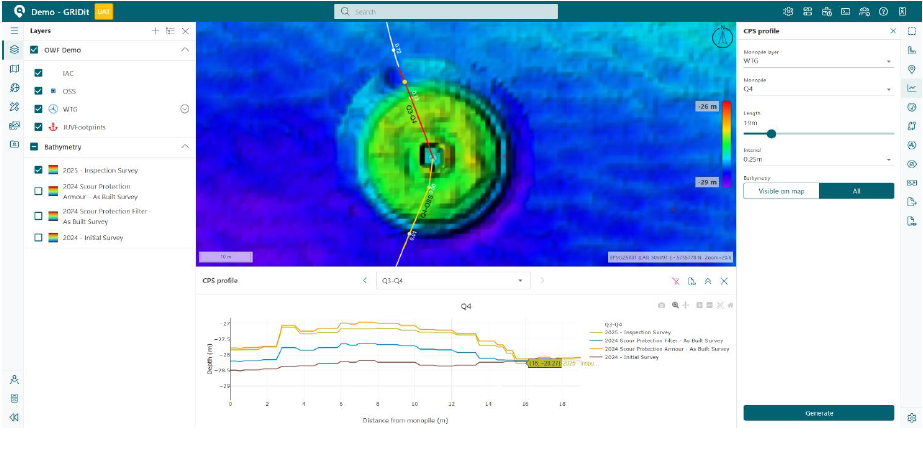
Cable Protection System (CPS) profile Create a profile from a monopile to the nearest cable endpoints. |
Profile Chart
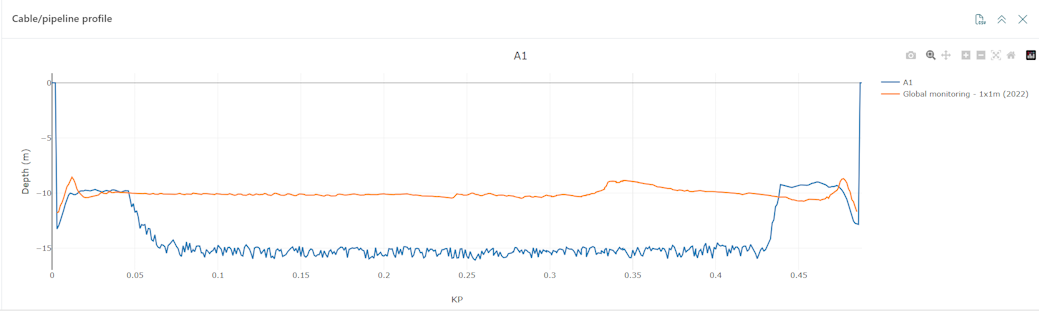
All of the above tools generate a profile chart at the bottom of the screen. The image above shows a cable (A1) and a bathymetry layer (Global monitoring - 1x1m (2022)). The y-axis of the chart shows the height of the cable/seabed. Hovering over a line in the chart gives the position and depth. A dot will also appear on the highlighted cable/pipeline on the corresponding position on the map.
With the blue icons on top it is possible to:
- Export the data of the profile to a CSV file for use in external applications.
- Expand or collapse the dialogue.
- Close the dialogue.
With the gray icons on top it is possible to:
- Create a snapshot and save it as an image.
- Zoom in and out. It is also possible to zoom in by drawing a box in the graph.
- Pan the profile to the left/right.
- Automatically scale.
- Reset the profile to its original view.
Clicking on a line in the legend will hide/show a line in the profile. Double-clicking on a line will single out the line and grey out the other information.
Cable/pipeline profile
This tool creates a profile showing the height of subsea cables and pipelines as recorded by surveys. The results are displayed in a single, convenient chart.
The tool, which creates a profile over a cable, automatically becomes available when the software detects the required layers with object type bathymetry and cable/pipeline in the project.
The dialogue can be triggered in two ways:
- From the right side menu on the map
- From the info panel when the selected feature has objecttype cable/pipeline or is a line feature. The profile icon appears in the action button bar.
Once selected a pop-up will appear on the right side of the map.
Options
| Option | Description |
|---|---|
| Cable/pipeline | A drop-down to select the target cable/pipeline. |
| KP | Once the cable/pipeline is selected, we can (optionally) select part of the cable/pipeline. This can be done by adjusting the slider or setting the start and/or end point manually. |
| Interval | Set the interval for points in the line chart. KP points as defined on the cable/pipeline are the default. It is also possible to set a fixed distance between the points. |
| Bathymetry | Selects the bathymetry layers to add to the line chart. Select ‘all' or ‘visible on map' bathymetry layers. |
Instruction Video
Map Profile
Create a profile from a line on the map. This can be a single straight line or contain several sub-sections. The line can be created in two ways:
- Drawing on the map: Under the cursor there is an orange point. Clicking once sets a point on the line. A double click ends the line and automatically generates a profile. Once the line has been created it is possible to drag the points to adjust the profile.
- Adding points in the dialogue: It is possible to manually set the XY coordinates of points in the options dialogue for precise control.
Options
| Options | Description |
| Line coordinates | Adds points to the line. Will be automatically set when a point is added by clicking on the map. |
| Interval | Sets the distance between the points in the graph. The default is one meter. |
| Bathymetry | Selects the bathymetry layers to add to the line chart. Select ‘all' or ‘only visible' bathymetry layers. |
Instruction Video
Radial Profile
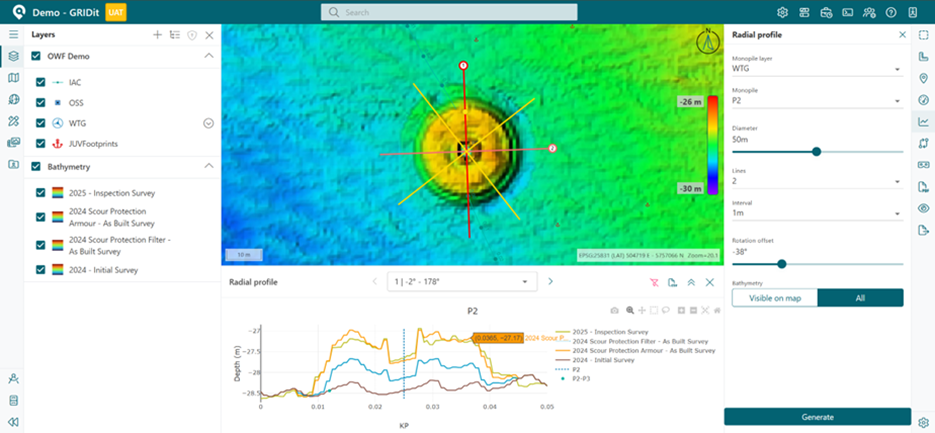
This tool allows GRIDit users to visualize the scour protection surrounding a monopile by creating a profile of several lines across a monopile position. The number of lines can be adjusted.
The dialogue can be triggered in two ways:
- From the right side menu on the map
- From the info panel when the selected feature includes a monopile. The profile icon appears in the action button bar.
Options
| Options | Description |
|---|---|
| Monopile layer | The layer with the monopile / feature. |
| Monopile | The monopile at the center of the radial profile. |
| Diameter | The diameter of each line across the center of the radial profile. |
| Lines | The number of lines in the profile. |
| Interval | Sets the distance between the points in the graph. The default is one meter. |
| Bathymetry | Selects the bathymetry layers to add to the line chart. Select ‘all' or ‘only visible' bathymetry layers. |
Profile chart
The generated profile chart has an extra drop-down menu to switch between the different lines. The selected line is highlighted on the map.
Instruction Video
Cable Protection System (CPS) Profile
The CPS Profile Tool allows users to monitor scouring around the Cable Protection System (CPS), the offshore wind asset that protects the cable between leaving the seabed and entering the monopile or J-tube.
With the CPS Profile Tool, users can configure profiles from the monopile up to (and including) the cable. Users select the profile length and interval.
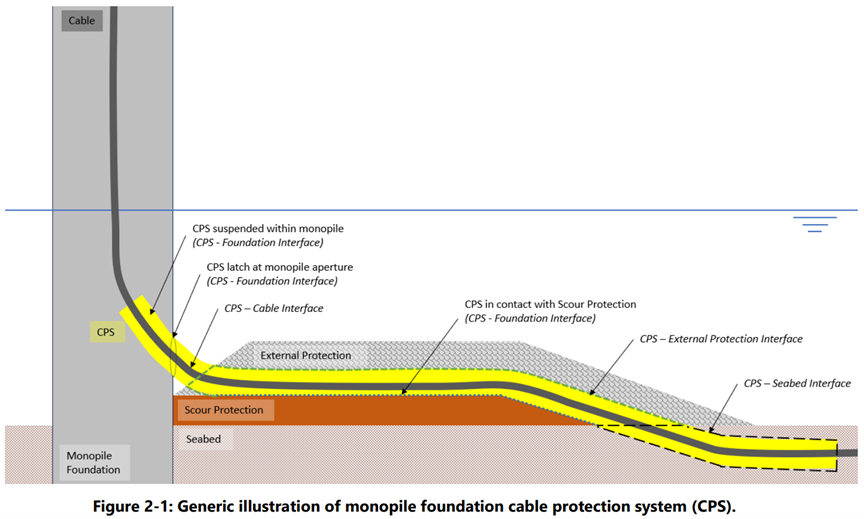
Source: Cable Protection Systems (CPS) best practice guideline / Carbon Trust Offshore Wind Accelerator (OWA), November 2024
Using the CPS Profile Tool
The dialogue can be triggered in two ways:
- From the menu on the right hand side of your GRIDit page. Select
 followed by
- From the info panel when the selected feature includes a monopile. The profile icon appears in the action button bar.


Options
| Options | Description |
|---|---|
| Monopile layer | The layer with the monopile feature. |
| Monopile | The monopile at the center of the radial profile. |
| Length | The length of the profile from the monopile. The default is up to the cable, but may be extended beyond. |
| Bathymetry | Selects the bathymetry layers to add to the line chart. Select either ‘all' or 'only visible' bathymetry layers. |
Profile Chart
The generated profile chart has a drop-down menu to switch between profiles. The selected profile is highlighted on the map in red (see below).