# Tutorials
Here are some tutorials that you may find helpful....
# Display a raster layer from GRIDit in QGIS
You can use the [Web Map Service (WMS) API](https://wiki.app.gridit.nl/books/gridit-user-manual/page/wfs-wms-external-applications "GRIDit User Manual - WFS & WMS APIs (opens in new window)") in GRID*it* to display a raster image in QGIS (support is limited to raster files).
#### How to display GRID*it* raster layers in QGIS
---
In order to be able to import the WMS service into QGIS these steps need to be taken:
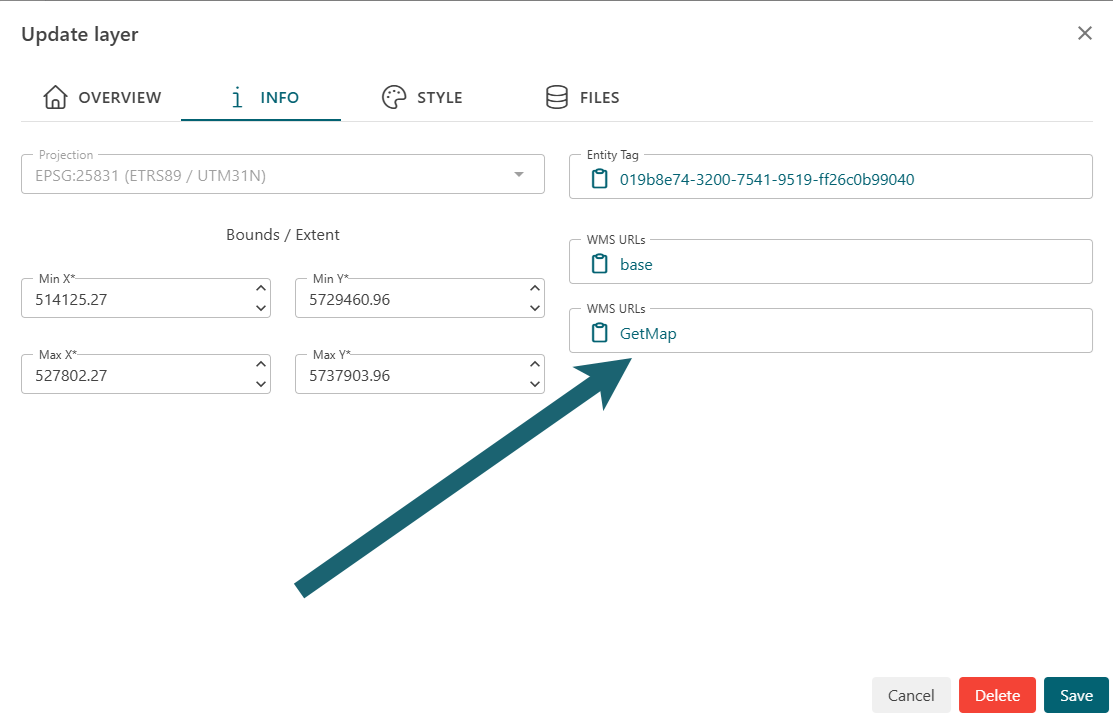
1. Get the URL from GRIDit
[](https://wiki.app.gridit.nl/uploads/images/gallery/2026-03/step1.png)
This looks like this:
*[https://api.gridit.nl/api/projects/5d031bb9-4a90-4679-b157-43af165b1614/layers/WMS?Service=WMS&Version=1.3.0&Request=GetMap&Layers=019b8e74-3200-7541-9519-ff26c0b99040&Format=image%2fpng&Transparent=true&Crs=EPSG%3a25831&BBox=514125.27%2c5729460.96%2c527802.27%2c5732653.96&Styles=&Width=1920&Height=1080&HideColorScale=true](https://api.gridit.nl/api/projects/5d031bb9-4a90-4679-b157-43af165b1614/layers/WMS?Service=WMS&Version=1.3.0&Request=GetMap&Layers=019b8e74-3200-7541-9519-ff26c0b99040&Format=image%2fpng&Transparent=true&Crs=EPSG%3a25831&BBox=514125.27%2c5729460.96%2c527802.27%2c5732653.96&Styles=&Width=1920&Height=1080&HideColorScale=true)*
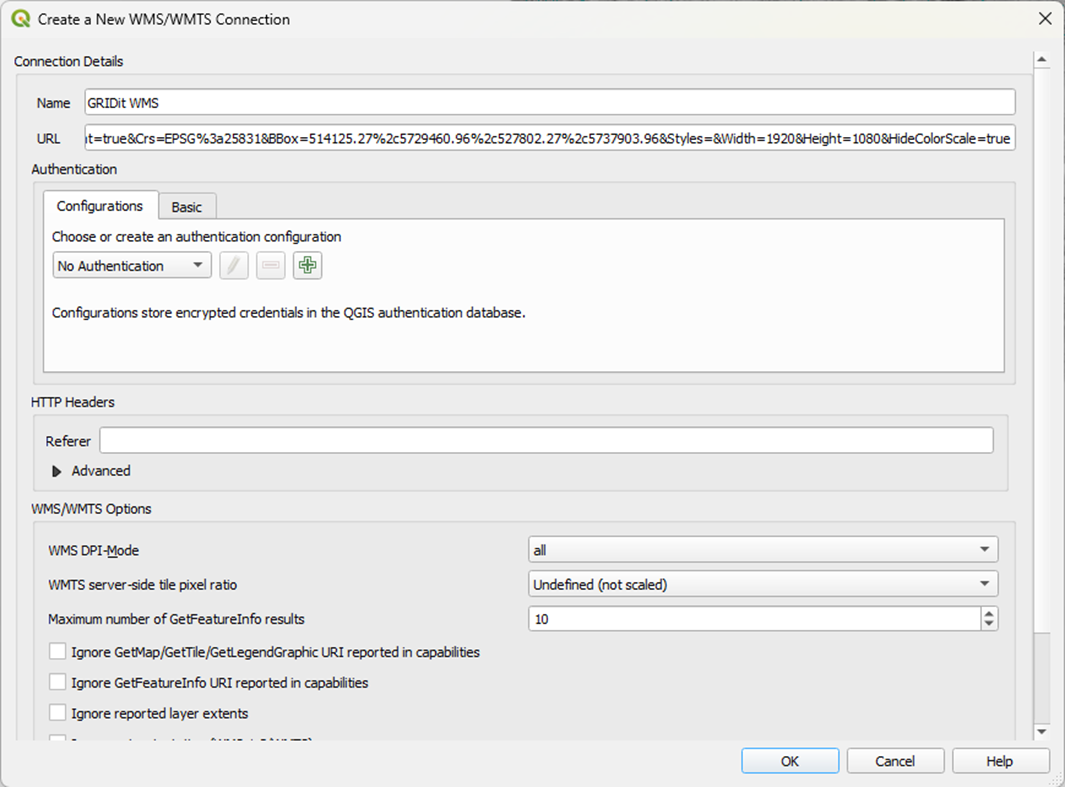
2. Create a new WMS in QGIS
Give it a name and paste the URL in the field URL:
[](https://wiki.app.gridit.nl/uploads/images/gallery/2026-03/step2.png)
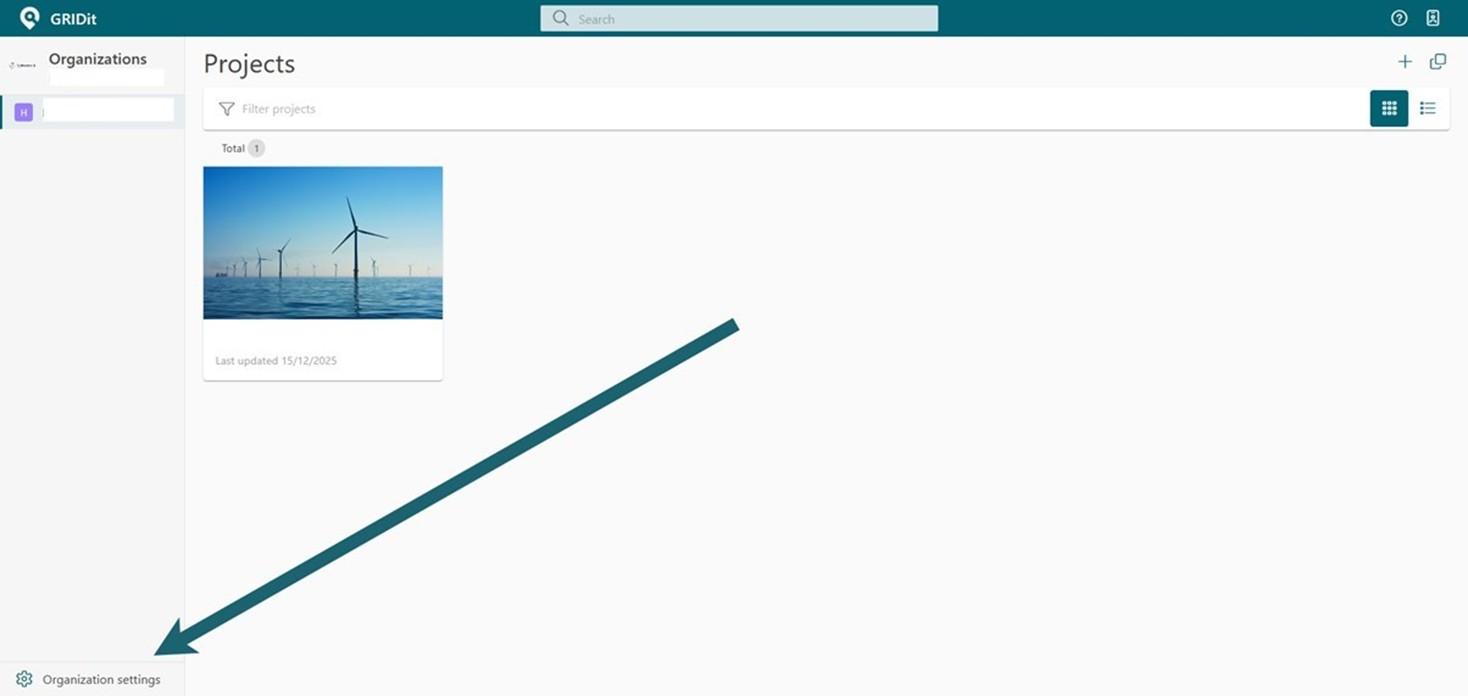
3. Get user authentication key from GRIDit
In GRID*it* and open the ‘Organization Settings’:
[](https://wiki.app.gridit.nl/uploads/images/gallery/2026-03/step3.jpg)
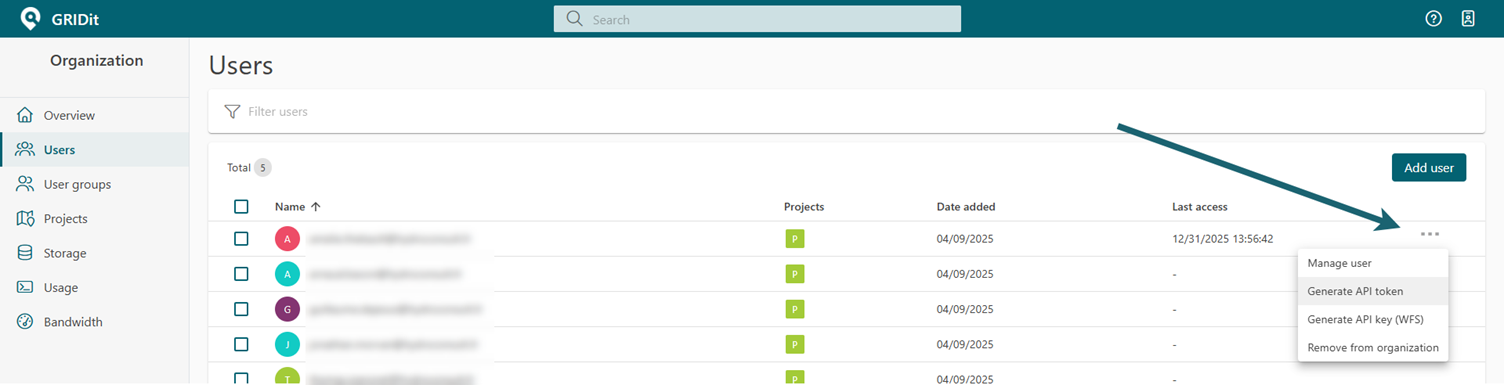
Click on ‘Users’ and find your email address which gives you access to GRID*it*.4. On the far right click the 3 dots and select ‘Generate API Key’ and copy it:
[](https://wiki.app.gridit.nl/uploads/images/gallery/2026-03/step4.png)
4. Create a new connection in QGIS
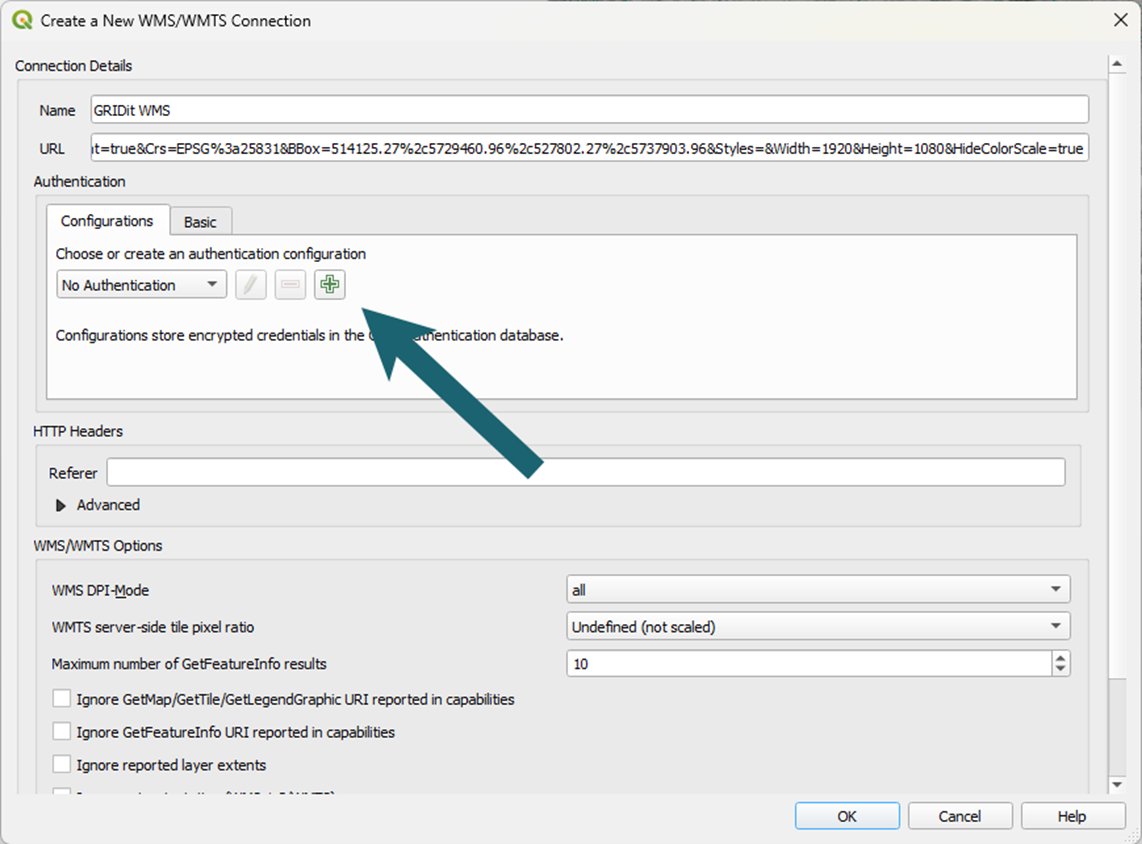
In QGIS click the **+** to open the authentication:
[](https://wiki.app.gridit.nl/uploads/images/gallery/2026-03/step5.png)
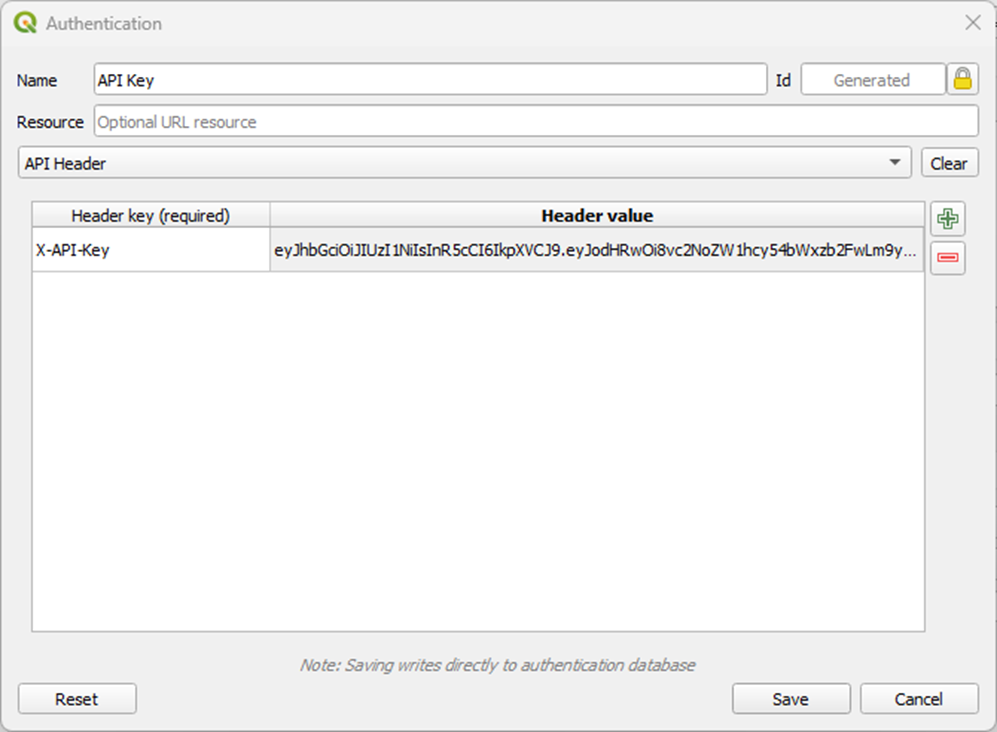
Again click on the **+** and enter the header key (X-API-Key) and the API key itself copied from GRIDit into ‘Header value’:
[](https://wiki.app.gridit.nl/uploads/images/gallery/2026-03/step6.png)
Then click ‘Save’ and in the next screen ‘OK’.
The raster layers should now be available in QGIS.
1. Install QGIS Plugin
1. Download the zip from [this link](https://www.gridit.nl/wp-content/uploads/2026/08/QGIS-Plugin-to-create-Routes.zip "Download QGIS-Plugin-to-create-Routes.zip").
2. Extract the zip to you computer. Within the zip is another zip **xyzkp\_to\_3d\_line\_plugin.zip**
3. Open QGIS Go to Plugins → **Manage and Install Plugins…**
4. Click the button “**Install from ZIP**”: You’ll find it in the lower-left corner
5. Select the ZIP file: Choose: **xyzkp\_to\_3d\_line\_Plugin**
6. Click “**Install Plugin**”: QGIS will unpack it and install it.
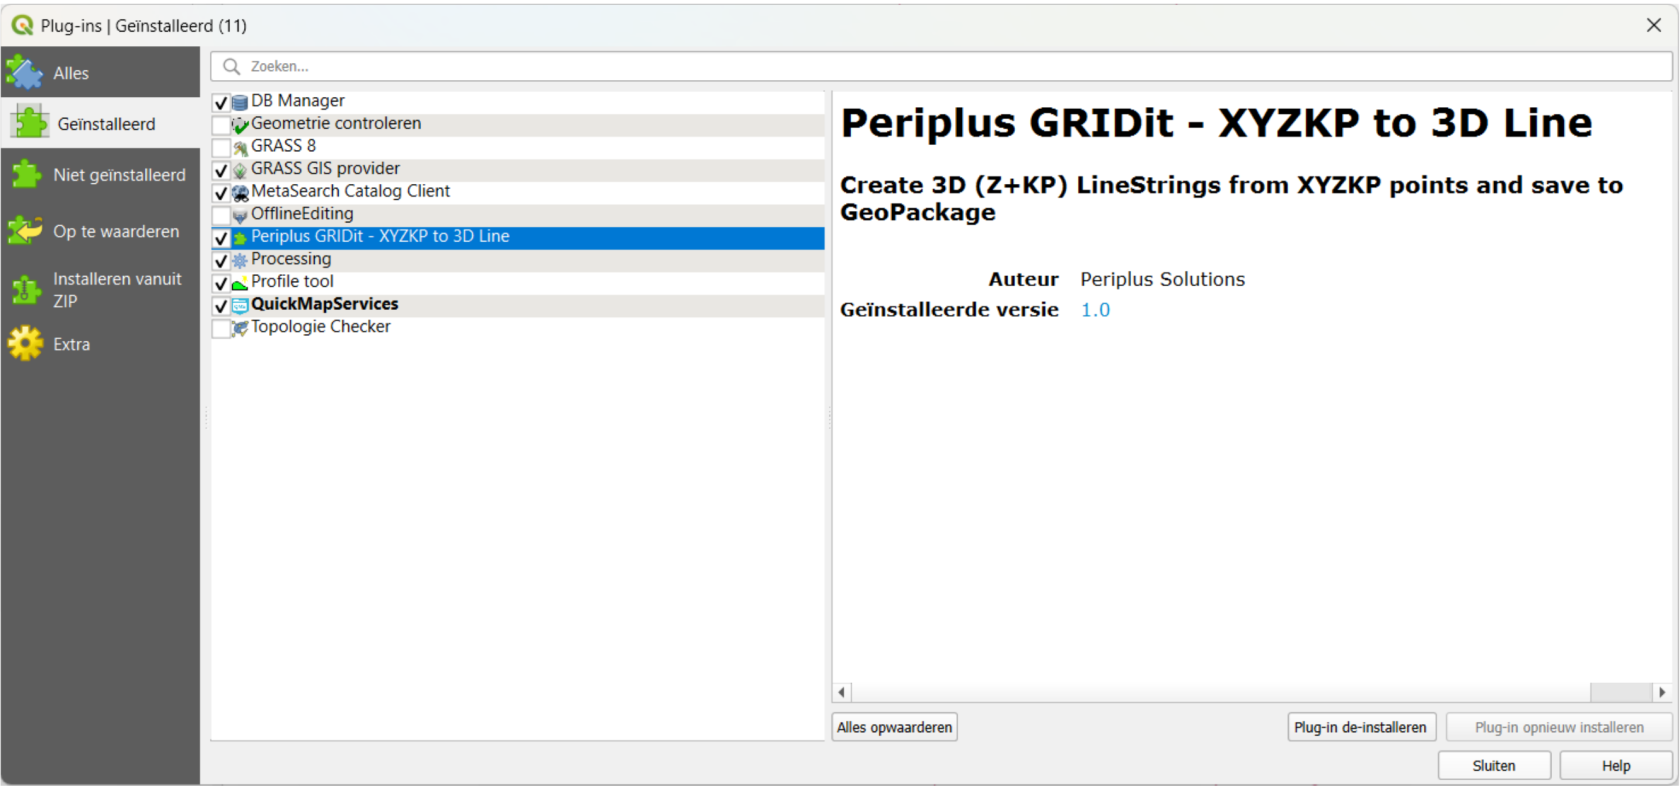
7. Activate the Plugin: After installation, ensure the checkbox is enabled
[](https://wiki.app.gridit.nl/uploads/images/gallery/2026-06/1-installed-plugins.png)
2. Run the plug-in
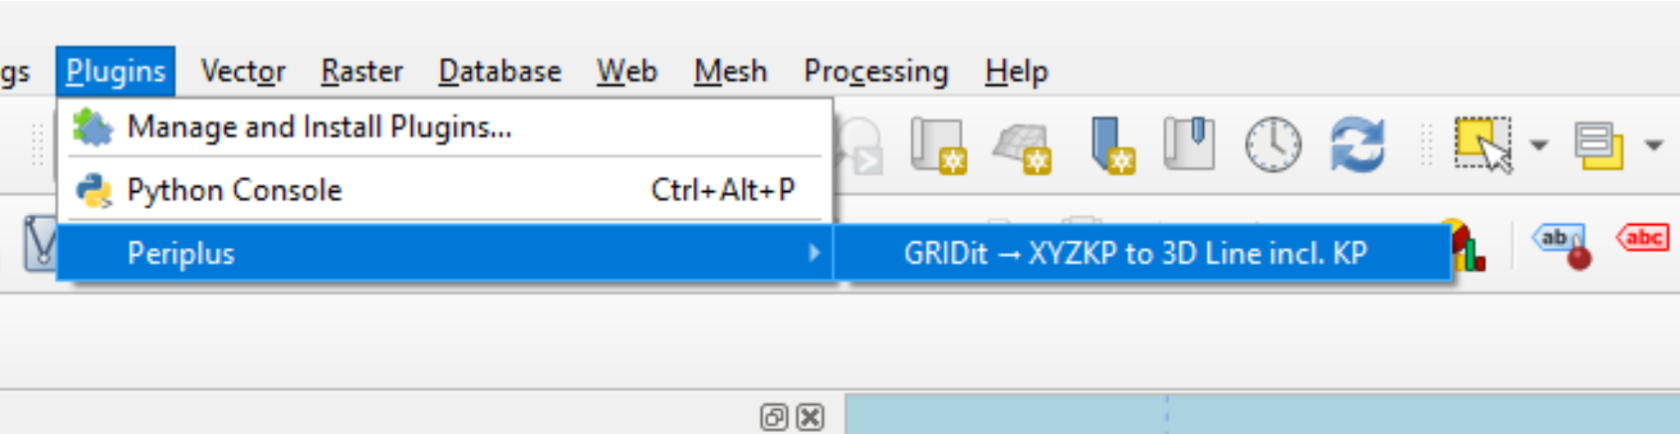
To add the plug-in to the toolbar: Menu bar / Plugins / Periplus / GRIDit → XYZKP to 3D Line incl. KP
[](https://wiki.app.gridit.nl/uploads/images/gallery/2026-06/2-add-tool-to-toolbar.png)
To open the tool: Select ot from the toolbar:
[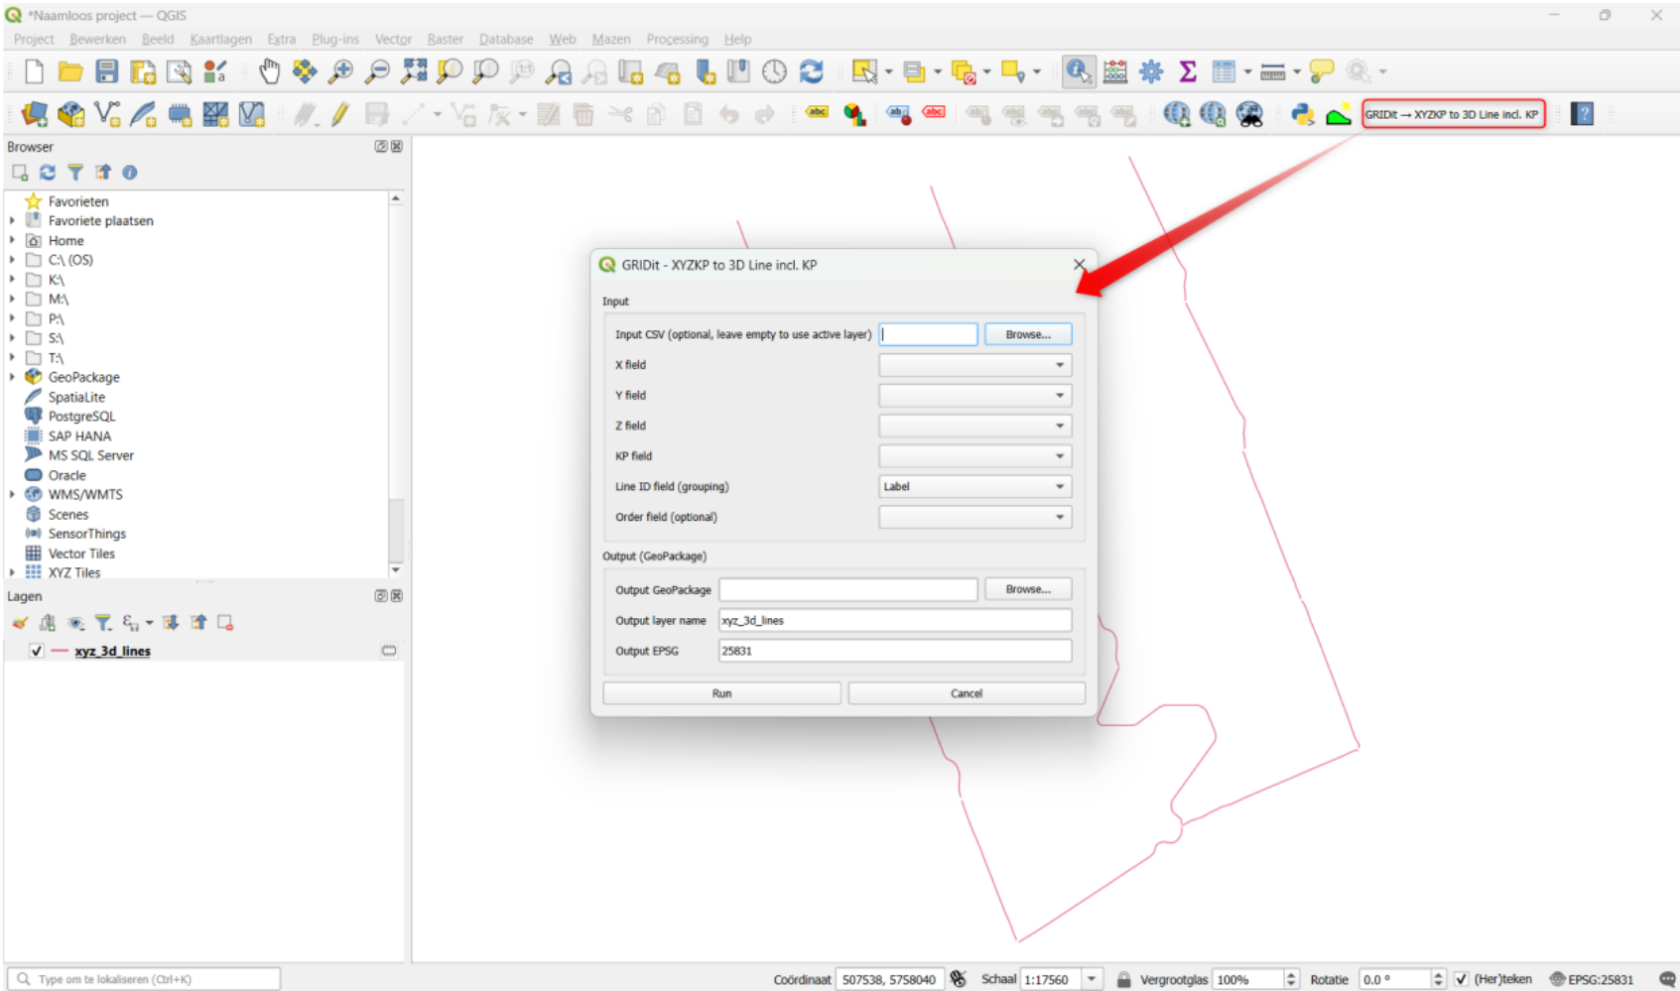](https://wiki.app.gridit.nl/uploads/images/gallery/2026-06/3-access-the-tool.png)
3. Add the KP distance to cable/pipeline
The input CSV for the QGIS Plugin needs to be formatted as shown below. In this CSV the start of a cable route is defined in a 1 meter intervals. Reducing the interval will give more details on the actual position of the pipeline/cable. It is advised to use ‘name’ as attribute containing the cable name. If this is not the case the correct attribute name containing the name needs to be configured in GRID*it* after creating the layer.
[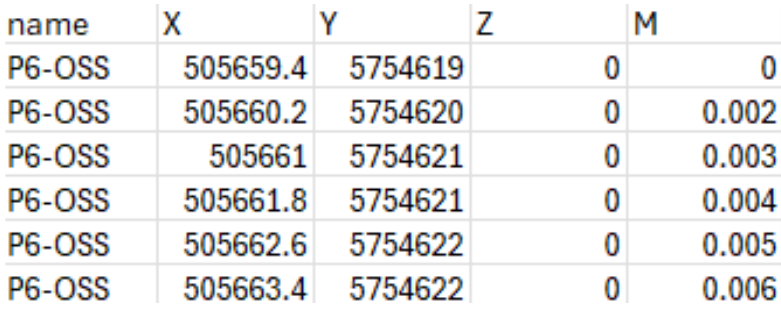](https://wiki.app.gridit.nl/uploads/images/gallery/2026-06/4-csv-input.png)
The attribute (or field-) names may vary, as they can be selected from the pull-down menu in the interface of the Plugin. The Plugin will be automatically populated with the expected fields, however the user can adjust the input parameters by choosing another attribute name from the pull-down menu. The user can also set the desired EPSG code.
[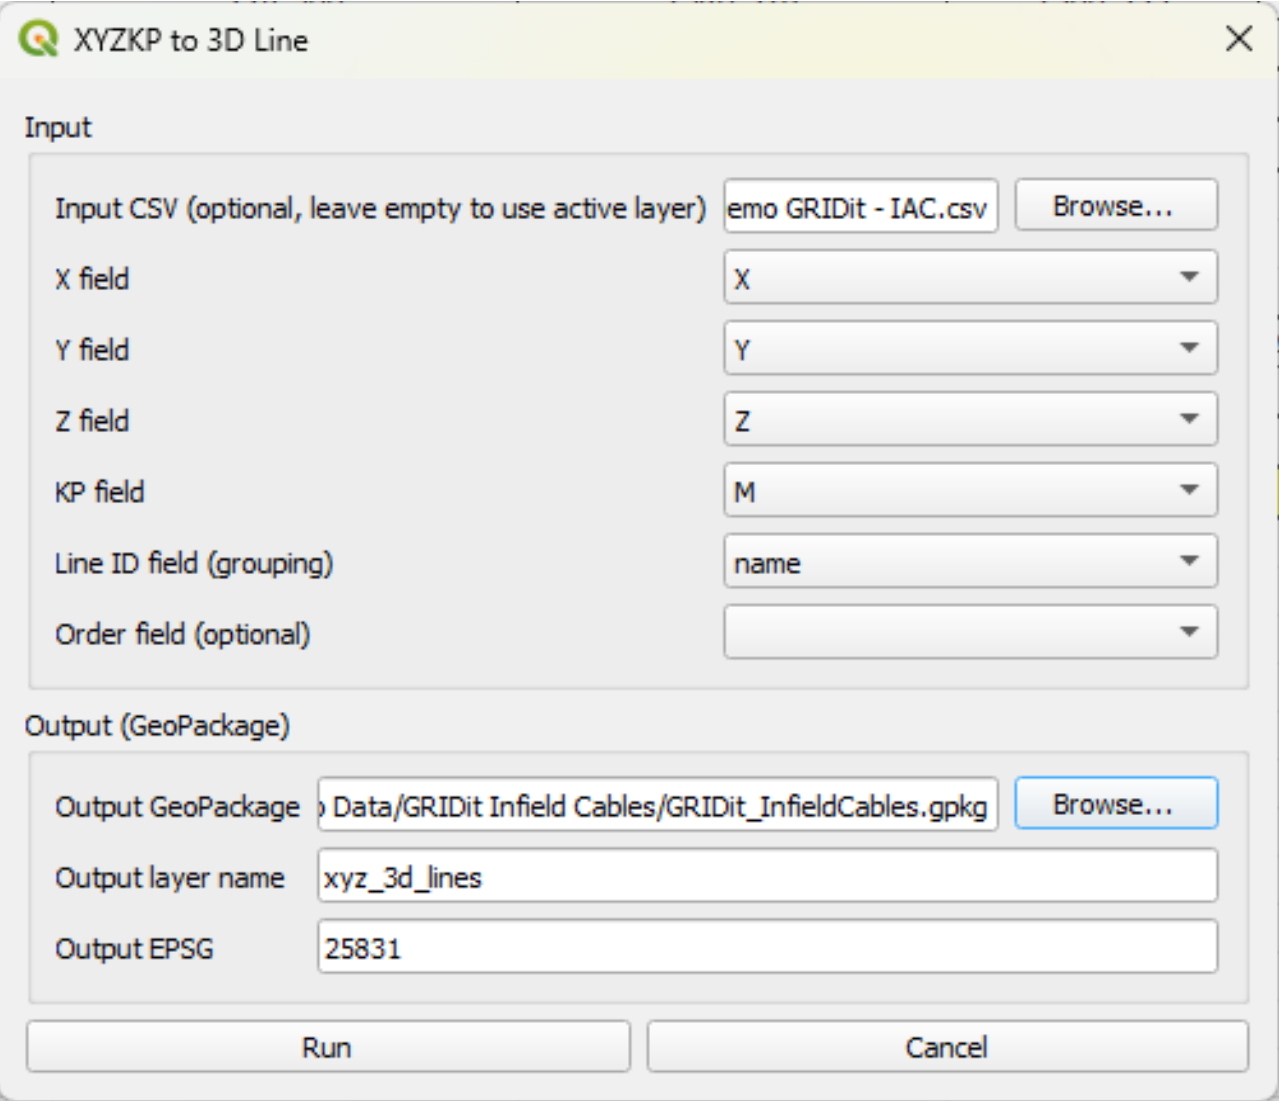](https://wiki.app.gridit.nl/uploads/images/gallery/2026-06/5-tool-dialog.png)
4. Create GeoPackage (.gpkg) for import into GRIDit
Run the script. The result is written to a GeoPackage (.gpkg). This dataset can be uploaded into GRID*it* (see [Add a Layer documentation](https://wiki.app.gridit.nl/books/gridit-user-manual/page/add-a-layer)). Set the object type of your layer to “Project cable/pipeline with depth”. This way the data will become available for the Profile and Burial Assessment tools in GRID*it*.
[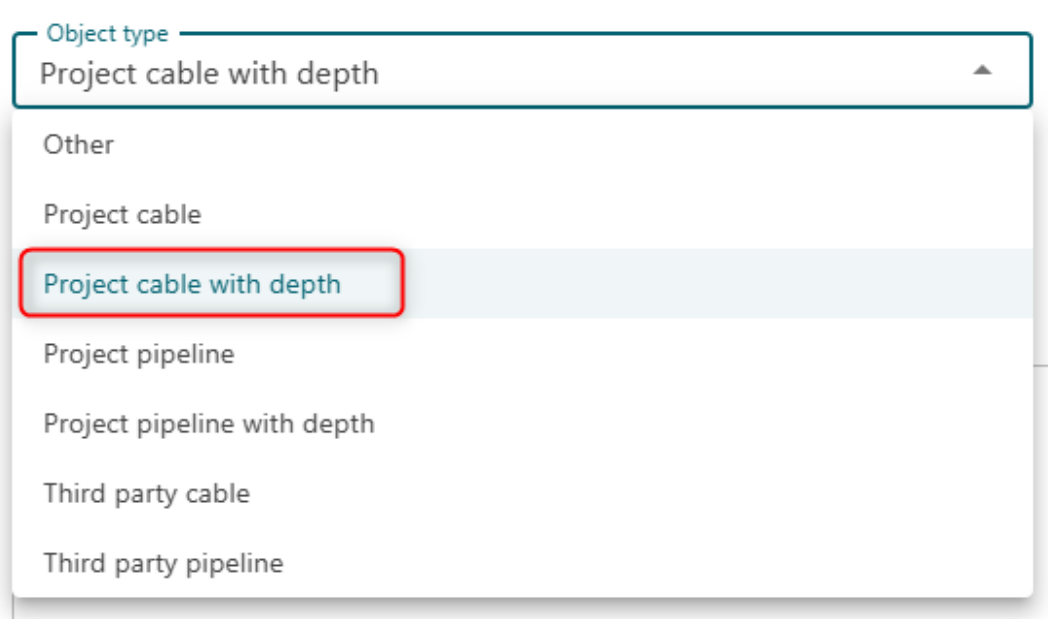](https://wiki.app.gridit.nl/uploads/images/gallery/2026-06/6-object-type.png)
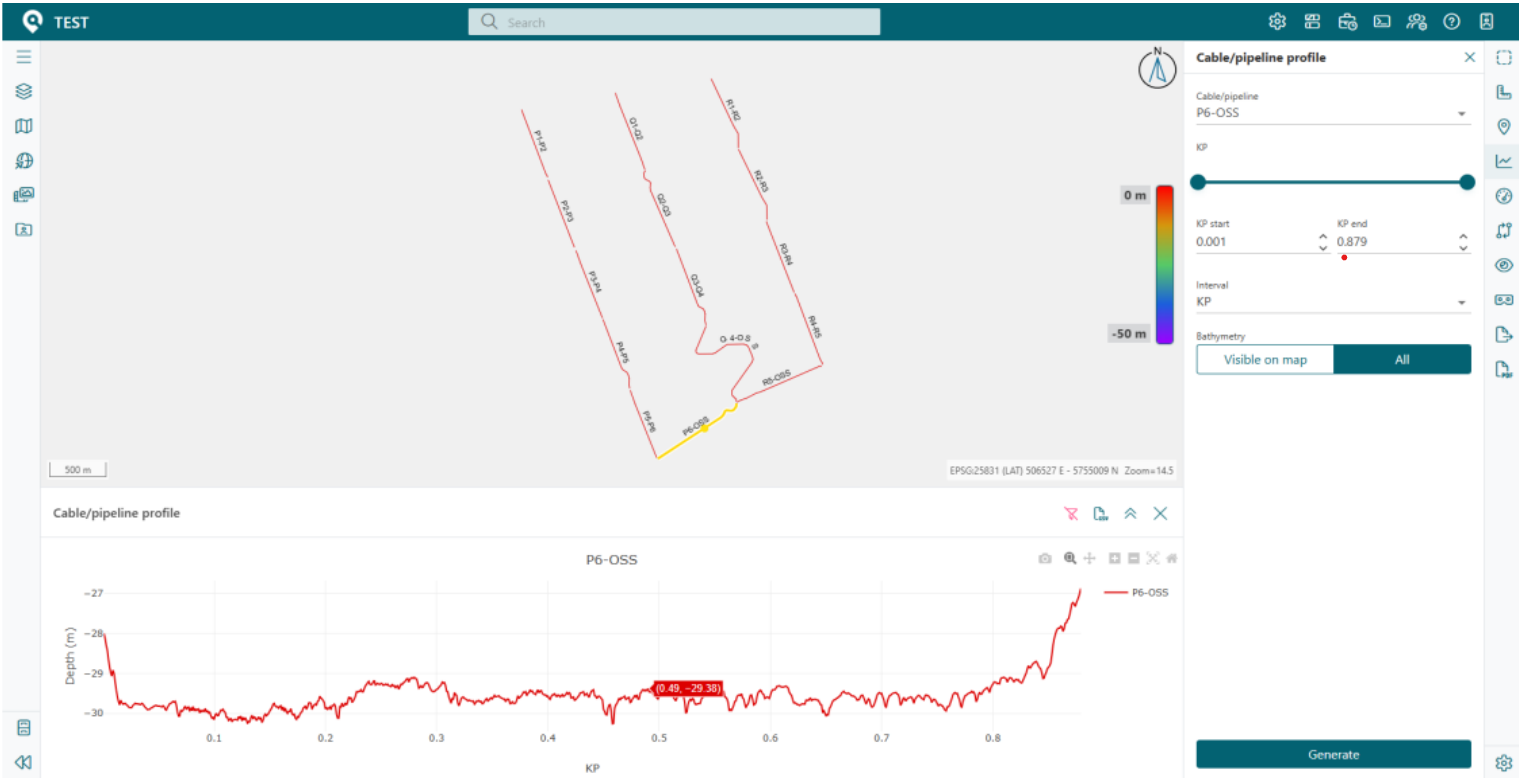
Data is shown in the Profile tool in GRID*it*.
[](https://wiki.app.gridit.nl/uploads/images/gallery/2026-06/7-profile-tool.png)
5. Additional attributes
Additional attributes from an external table, such as cable characteristics, can be joined to the GeoPackage dataset in QGIS. The additional attributes will become available in GRIDit and can be viewed in the attribute table and info panel.