Layer Manager & Importing Data
Describes how to import data into a project, work with layers and display a background from an external source.
Layer Manager
Introduction to Layer Manager
Layers represent different datasets that can switched ‘on’ and ‘off’ according to users' preferences.
The Layer Manager allows users to select which datasets they wish to visualize and process. Choose which layers to view, switch easily between different datasets, and save the layers (or combinations of layers) that you view most frequently.
By default, when you open a project the layer manager will be open.
 You can collapse/expand the Layer Manager by clicking on the layer icon .
Layer Tree View
Users can ask GRIDit to remember different configuration of layers. This allows users to store the combinations of layers that they use most often. It also allows users to switch easily between pre-stored layer configurations.
- Click the ‘layer tree view’ icon
 .
. - To save the combination of layers that you are currently viewing, click ‘save’ and give your view a name. This name will appear on the ‘layer tree view’ drop down menu in the future.
- Click ‘reset’ to delete the more recent unsaved changes that you have made.

If you have any questions, please contact support@gridit.nl.
Select Layers to View
There is a checkbox to the left of each layer. If the box for that layer is checked, the layer will be visible on the chart.
GRIDit automatically remembers which boxes were checked or unchecked when you last closed the project. These layers will open automatically the next time you open GRIDit.
Add a Layer
Adding a new layer
The data flow
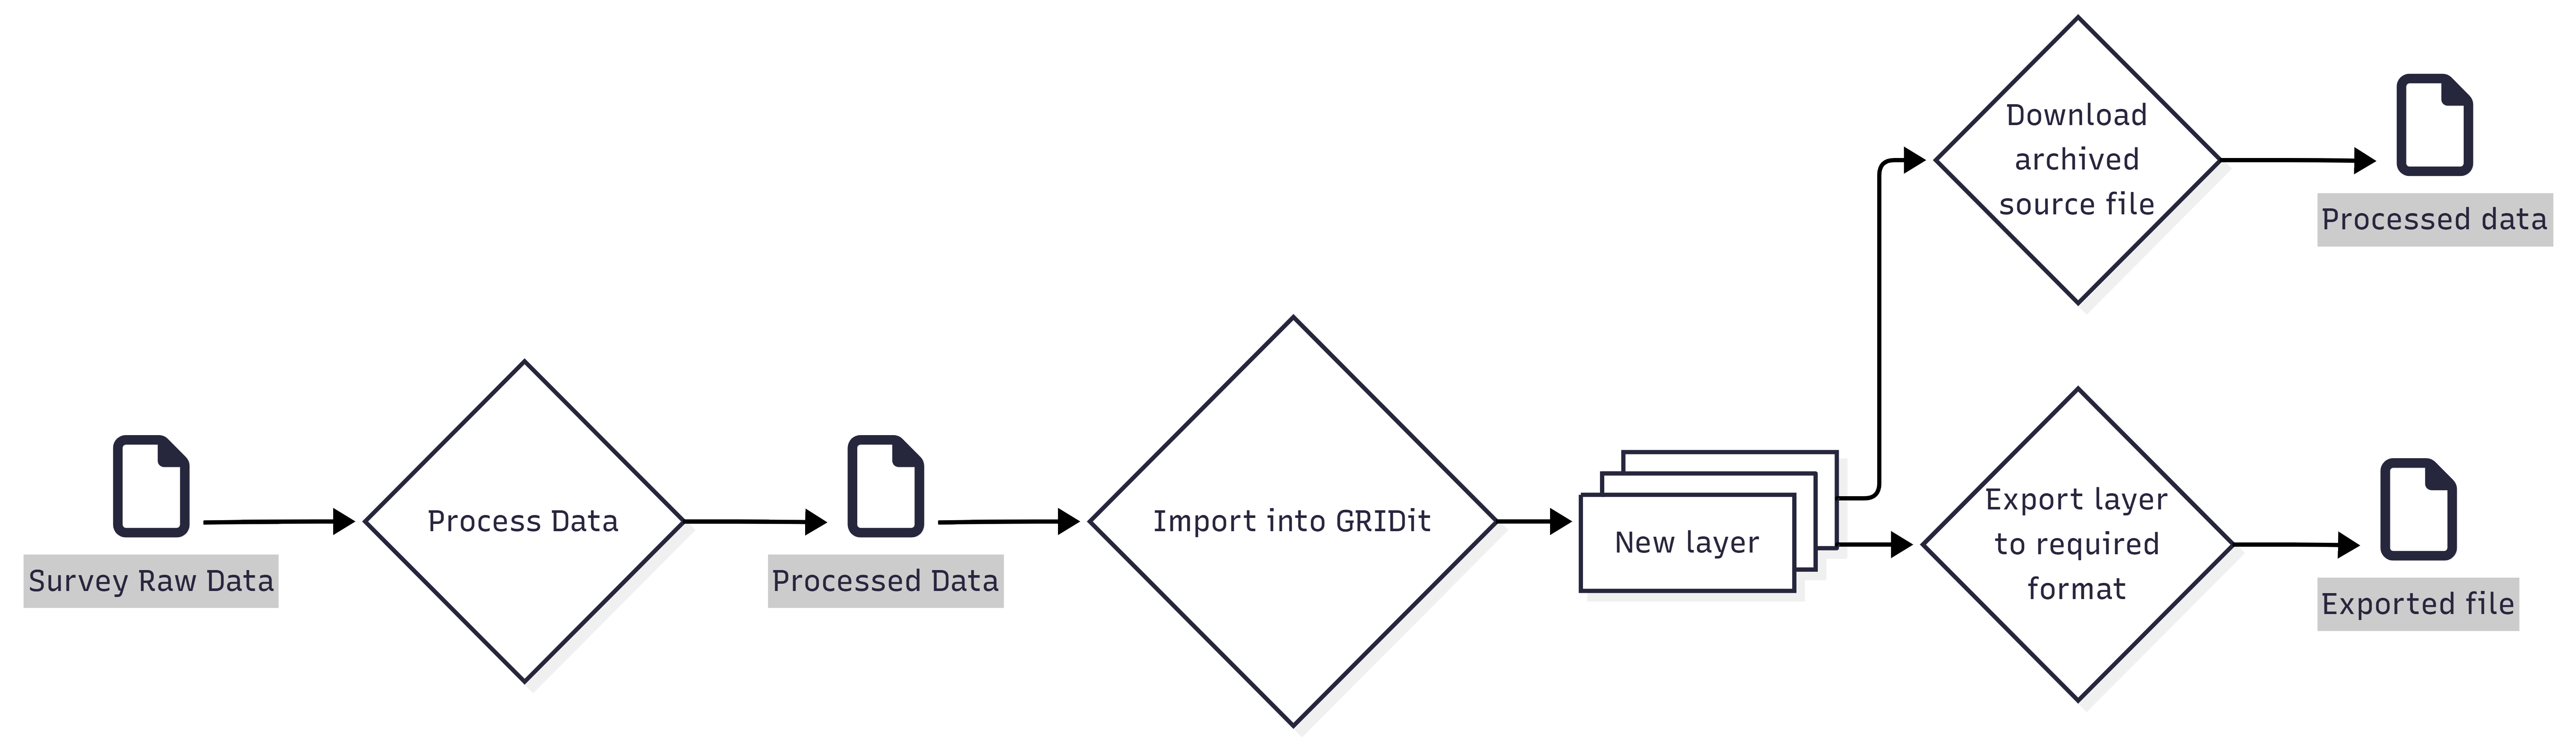
To create a new layer you need to import data (see below for supported formats). The process is as follows:
- Raw survey data is processed to create a file that's ready for import.
- The resulting file is imported into GRIDit, creating a new layer.
- GRIDit stores this data and archives the file used to import the data. This archived file can be downloaded at anytime but won't contain any changes made after upload. If you need any changes made to the layer, use the export function.
Supported file formats
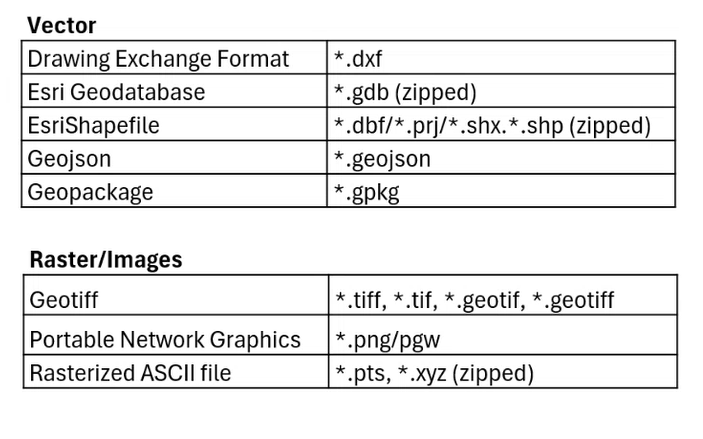
The following file formats are supported:
How to add a layer
There are two ways to add a new layer:
- Drag and drop a file from your explorer on the chart. The ‘upload layer' window will open automatically.
- Click the + button at the top of the layer menu and select ‘add layer'.
The Upload Layer File window will open automatically (see below).
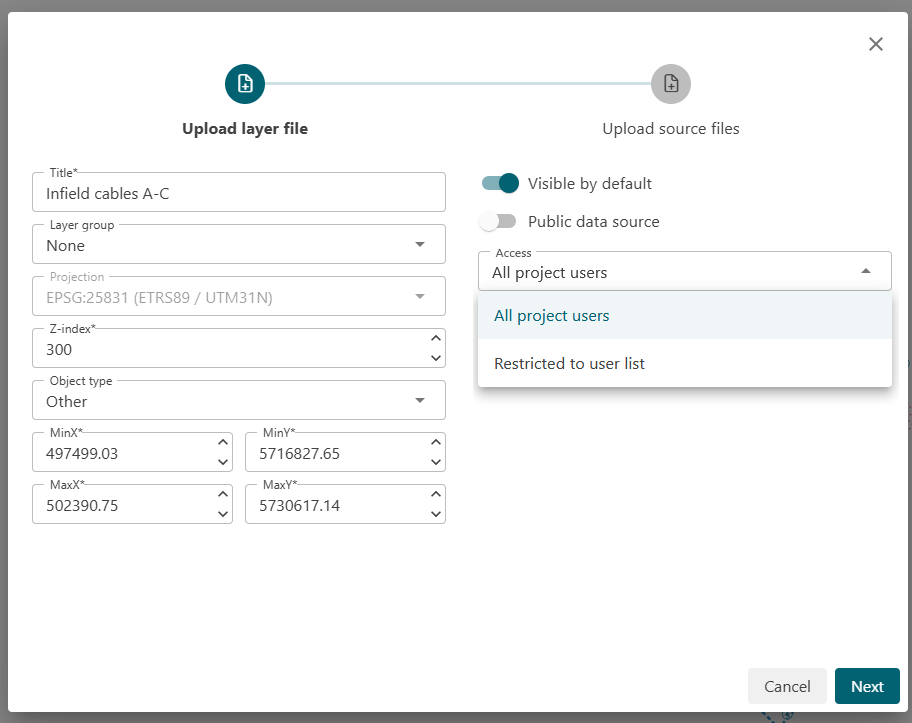
GRIDit will import the data and make it visible in the project . If you would also like to save a copy of the file in its original format for archival purposes, clock ‘upload source files'.
If appropriate, add the file to a layer group and/or select an ‘object type'.
As of 2026.1 release you can restrict access to a layer, this can be set when importing. Please read the Project & Layer Access Page for more details
Downloading and archived source file
When you create a layer, the file that is used to create the layer is saved to the layer as a "source file". You can download this file at any time.
Downloading a source file that has been archived will not contain any changes that were made to the layer after it was created. If you need the latest data, please use the export function.
Exporting a layer
In some cases users would like to export a layer to use in another software application. For this you should use the export layer functionality. It's important to differentiate that exporting data is not the same as downloading an archived source file that is stored within a layer. For more information see the Export layer page.
Exporting will include any changes made after the layer was created, downloading an archived source file does not.
Sharing Layers
When GRIDit users with a ‘reader’ license upload a new layer, it will automatically be set to ‘private'. Only the user themselves can view the layer.
GRIDit users with ‘admin' or ‘contributor' licenses can share the layers that they upload by toggling the ‘private layer’ slider to the right. The layers will be shared with other users within your project. They will not be visible to anyone outside your project.
Editing a Layer
Users with a reader license can edit their own private layers. Users with an admin or contributor license can edit all layers. See Edit Layers page for details.
Edit a layer
Who can edit layers?
The option to edit layers is available to users with the relevant permissions: contributors, admins and those who have been permitted to edit by their project admin.
How to edit layers
Click on the context menu (…). A menu will appear. Choose edit (at the top of the menu).
An ‘Update Layer' dialogue box will open.
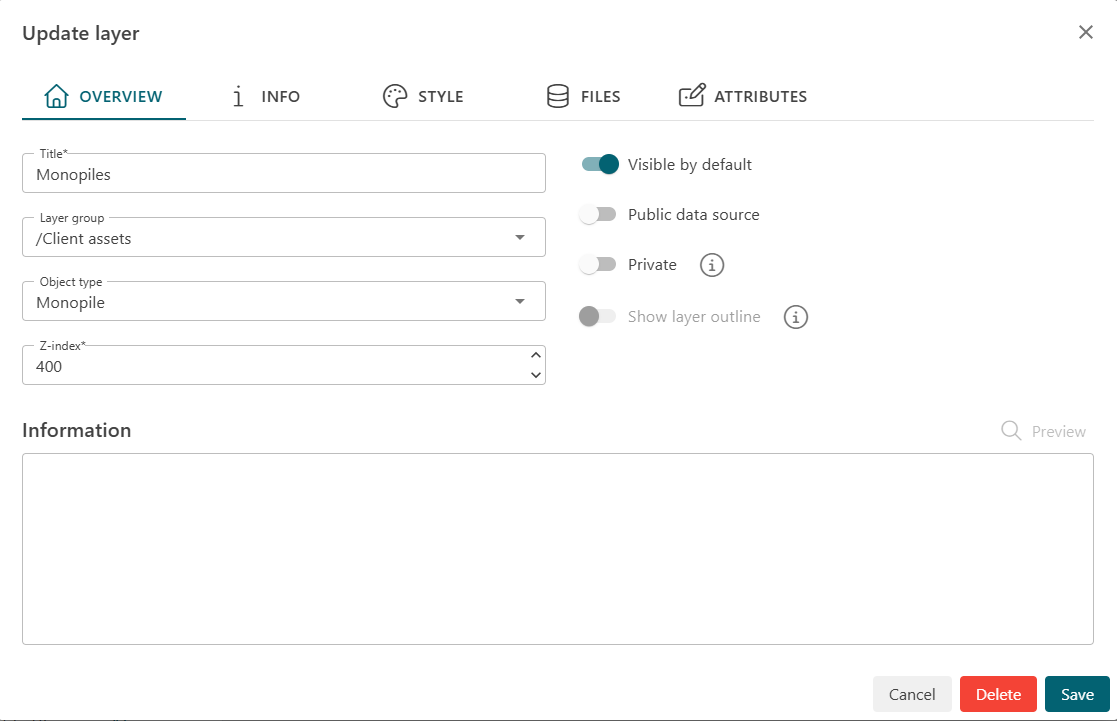
Editing the data within a layer
Click on the context menu (…) of a layer. A menu will appear. Choose Attribute table (at the bottom of the menu).
An Attribute table will appear. Select the "enable edit mode" icon ( ) and edit the value in the attribute table. You can save (
 ) or discard (
 ) the changes you made.
Overview Tab
This opens by default. With this tab you can:
- Modify the title of the layer.
- Move the layer to a different layer group.
- Choose the object type. The correct classification is important for using GRIDit's tools. For example, the radial profile tool will only pick up objects classified as ‘monopiles'.
- Z-index. This affects how layers are visualized in relation to their height. In general, bathymetry data has the lowest z-index, while objects that sit on top of the seabed have a higher z-index. The default setting is 400.
- Information box: Useful for reminders and sharing relevant information with your team. Once information has been added, an ‘information' option will be visible in the drop-down menu that appears when the layer's context menu (…) is clicked.
- ‘Visible by default' switch: This is toggled on by default, which means that the layer will be visible when the project is loaded for the first time. If you prefer the layer to be hidden by default, toggle this switch off.
- Public data: This is toggled ‘off' by default. If this is toggled ‘on' and the change saved, a small globe icon will appear next to the selected layer in the layer menu. This signals to colleagues that the data in this layer is derived from a public source.
- Private: This is toggled ‘off' by default, which means that other members of your team can view the layer. If switched ‘on', this layer cannot be viewed by any other users.
- Show layer outline (contributor only): This is set to ‘off' by default'. Setting this to ‘on' allows you to hide the data layer behind a gray box (as viewed by other users). If this is switched ‘on' a ‘share' tab will appear. This is helpful if you want other with permission to view your layers that data exists and request permission to view the data (see Share Layers).
Info Tab
Shows ESPG projections and the bounds of your data.
External applications can directly access data stored within Gridit. This is done via industry standard API calls.
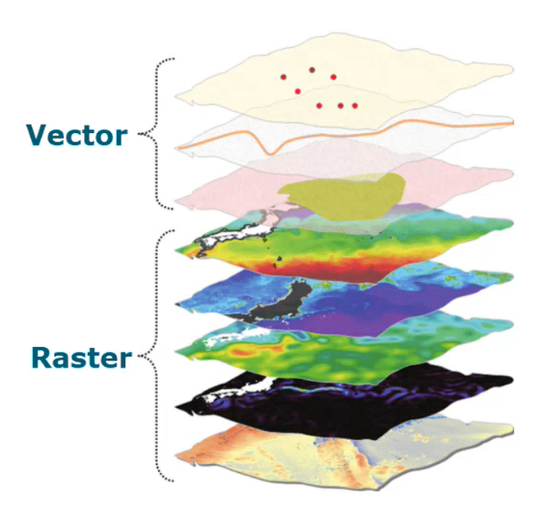
- Vector data: WFS
- Raster data: WMS
The data is secured with an API key, see the WFS & WMS APIs page for more information.
Style Tab
A style is the way a feature is drawn on the map. Each feature type (point, line, area) has a number of predefined styles. You have the option to alter the default styling by changing the color, size, label and other relevant information.
You can also change the ‘clustering’ settings for your layer. By default, objects will cluster as you zoom out and more detail will be seen as you zoom in. You can change the parameters according to your preferences.
Files
Download the uploaded files or upload a new data file for the layer. Source files can be added as a reference. GRIDit will not use them, but can be used to attach/store the original raw unprocessed data files.
Attributes
All features have one or more attributes. On this page we can alter the way GRIDit handles the attributes. The attribute can be shown in the attribute table option in the layer context menu or when a info panel is opened by clicking on a feature on the chart.
| Field | Description |
| Name | The original attribute name from the data. |
| Type | The type of data for each attribute value. |
| Alias | The human readable attribute name as used in the info panel and attribute table. |
| Searchable | True if the attribute should be included when searching with the search bar at the top. |
| Visible | True if the attribute should be shown in the attribute table. |
Export a layer
After a layer has been edited in the GRIDit database users (who have access) may want to export a layer to use in another software application. There are two ways to export layers:
- One layer at a time.
- Multiple layers at once.
It's important to differentiate that exporting data is not the same as downloading an archived source file that is stored within a layer. Exporting will include any changes made after the layer was created, downloading an archived source file does not.
Exporting a single layer
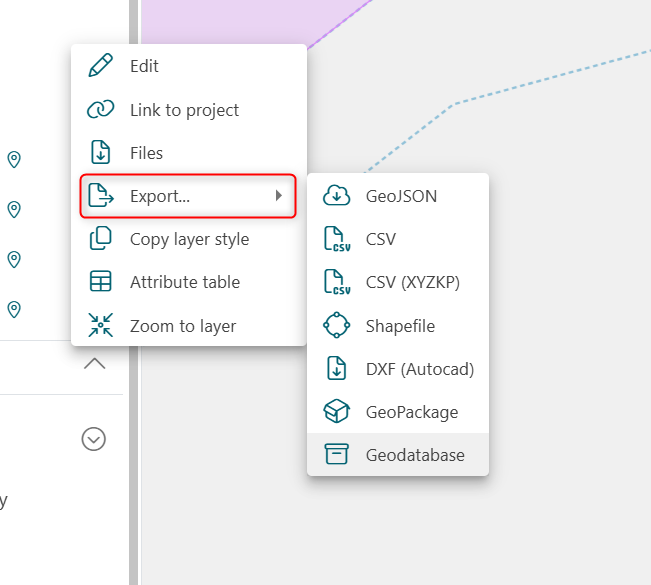
To export a single layer select the layer context menu (...) and then export. Select the format you would like to export to:
Exporting multiple layers
You can also export multiple layers to a variety of formats. This can be done using the Export layers tool (  ).
).
- Select the export layers tool (
 ).
). - Using the mouse cursor, left click an area on the map and drag the rectangle around all items you would like to export.
- Any item that the rectangle partially includes will be made available for export.
- Choose the output format you would like.
- Choose the bathymetry layer and the vector layers you would like to export.
- Select export, the browser will ask the user where to save the file.
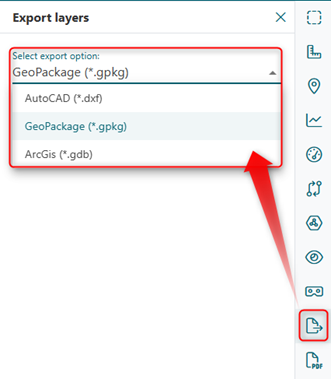
Only one bathymetry layer can be exported when using this functionality (along with multiple vector layers).
Backgrounds
Background layers allow GRIDit users to view their data in different contexts.
By default, the ‘GRIDit background' layer is shown. This plain background puts your data in the foreground.
However, users can choose to view their data against a variety of backgrounds, including topographic and navigational charts.
Change Background
Click the 'folded chart' icon ( ) to see five options:
- GRIDit background (default)
- OpenStreetMap
- ESRI World Topo Map
- ESRI World Imagery (Satellite Image)
- ESRI World Gray Canvas
This layer will always display on the bottom (it is not configurable).
Backgrounds from External Services
To display your data against a background of detailed nautical charts, click the 'globe with arrow' symbol ( ). Users will see the following options:
- Open Sea Map (information and legend)
- ENC - Electronic Navigational Charts (information and legend)
This layer will always display above a background but below all layers imported by a user.
If you have any questions, please contact support@gridit.nl.
Private Layers
A private layer can be created by uploading data, or as the result of a calculation within GRIDit.
The private layers that you create are, by default, only visible from your account. You can choose to share your private layer with colleagues.
As with any other layer, you can adjust the styling of your private layer, and view the attribute table. However, your colleagues cannot see the layer.
Create a Private Layer by Uploading Data
You can drag and drop a file from your explorer into the chart.
For more options, click the + button at the top of the layers menu and you will see the following choices:
- add layer
- add group
- add WMS layer (static image files)
- add WFS layer (vector data)
For information on supported file formats that can be imported, see the Supported formats section of Add a Layer. Not, this functionality will be deprecated soon.
Create a Private Layer From GRIDit Calculations
You can create a private layer by saving the results of the following GRIDit calculations:
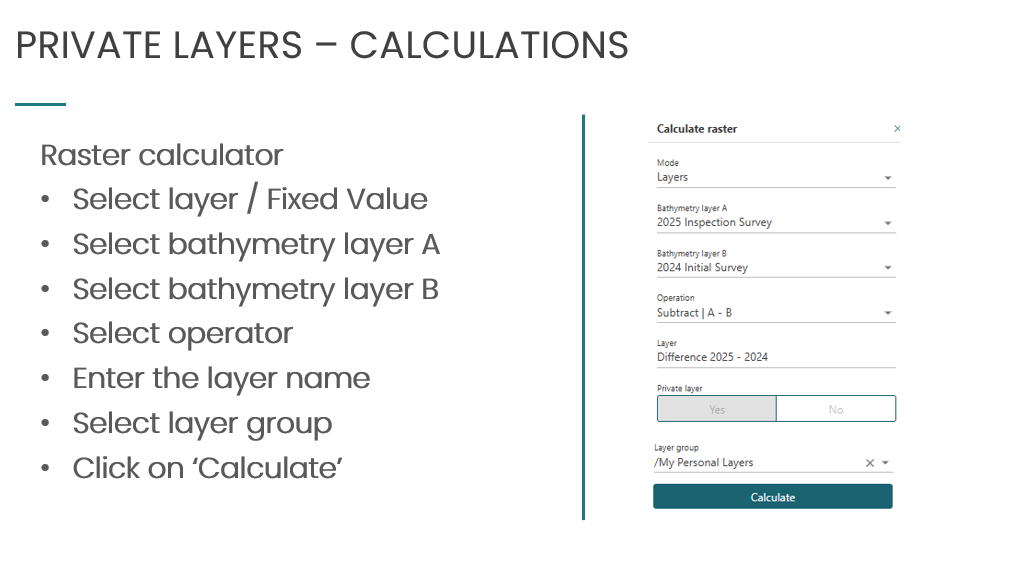
Calculate Raster
Add, divide, multiply or subtract the difference between raster layers, then save as a private layer.
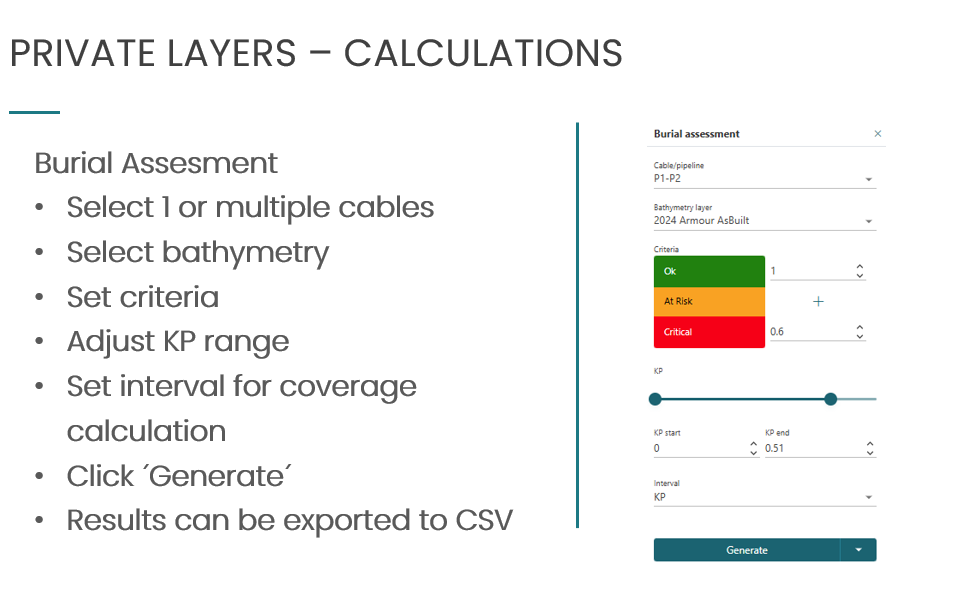
Burial (Difference) Assessment
Calculate the amount of cover above a cable/pipeline then save as a private layer.
Markers
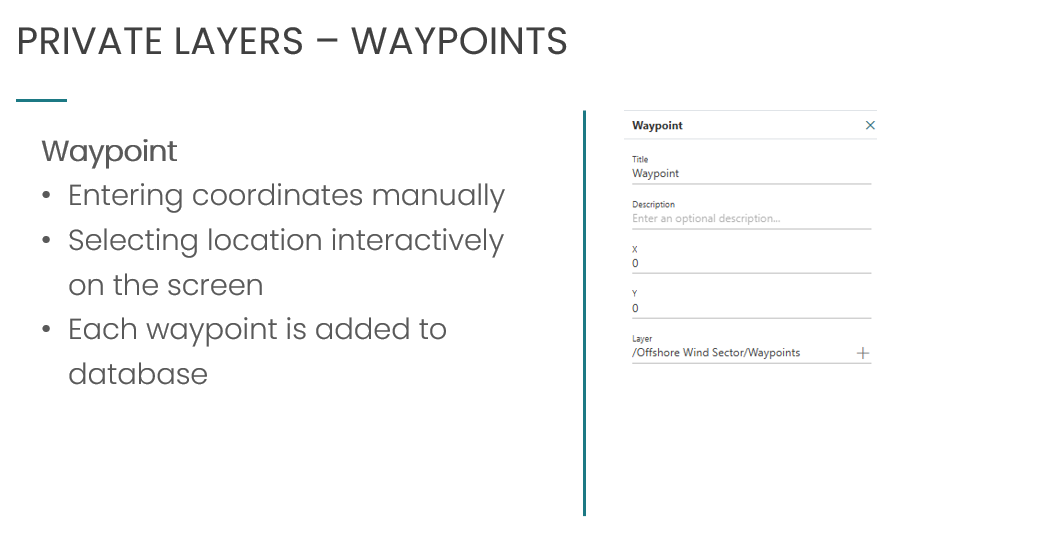
Enter coordinates manually and save as a private layer.